OpenTelemetry collector
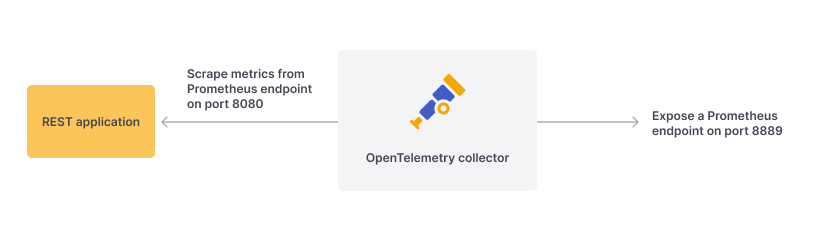
OpenTelemetry collector 用于接收数据,通过一系列处理后,导出数据给数据库(比如 prometheus)
它一般位于应用程序和监控程序中间。
它是一个 golang 开发的 cli
从下面链接可以下载该 cli
https://github.com/open-telemetry/opentelemetry-java-instrumentation/releases
创建配置文件 collect-config.yml
1 | receivers: |
使用命令 ./otelcol --config=collect-config.yml 启动
该 cli 启动后,会每隔 5 秒,从 localhost:8080/actuator/prometheus 路径拉取 prometheus 格式的 metric,然后交给 processors.batch 处理加工数据,最后导出成 prometheus 的格式,挂载端点为 localhost:8889,访问 http://localhost:8889/metrics 可以看到该端点输出了 prometheus 格式的数据,最后在 prometheus 上配置,从该端点定时拉取数据即可。
Opentelemetry collector contrib
https://github.com/open-telemetry/opentelemetry-collector-contrib
除了标准的 cli 之外,官方还有一个标准 cli 的补充。标准 cli 只提供了简单的几个 receiver,exporter,而 contrib 版本提供了更多对不同框架的支持。打开上述链接,比如查看 exporter/lokiexporter,它提供了对 loki 的支持
OpenTelemetry Java instrumentation agent
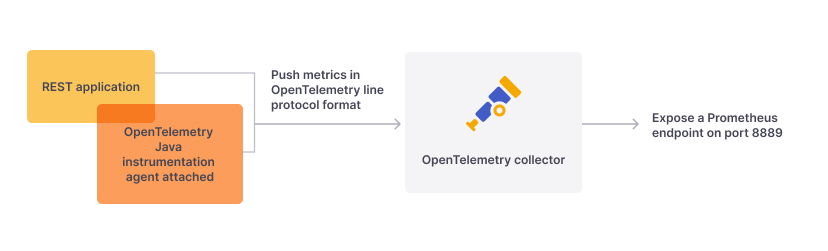
除了主动从 url 拉取数据,OpenTelemetry collector还支持应用端主动推送数据。
对于一个 java 程序,OpenTelemetry 官方提供了 java agent 可以对一个应用进行插桩,java agent 获取到指标后,主动推送给 OpenTelemetry collector。
首先修改 collect-config.yml 文件
1 | receivers: |
使用命令 ./otelcol --config=collect-config.yml 启动
java agent 用来收集信息,它可以直接帮你的应用暴露 metric 端口,也可以主动推送 数据 给 OpenTelemetry collector
然后我们开始下载 java agent,下载链接如下
https://github.com/open-telemetry/opentelemetry-java-instrumentation/releases
用以下命令启动提前准备好的 jar 包,java -javaagent:./opentelemetry-javaagent.jar -jar ./bootJar.jar
启动后,agent 就会自动捕获信息,推送到 localhost:4317,打开 http://localhost:8889/metrics 可以看到 collector 已经获取到数据,并准备好了 prometheus 的 endpoint 端口
如果推送时报了以下错误
ERROR io.opentelemetry.exporter.internal.grpc.OkHttpGrpcExporter - Failed to export spans. Server responded with UNIMPLEMENTED. This usually means that your collector is not configured with an otlp receiver in the “pipelines” section of the configuration. If export is not desired and you are using OpenTelemetry autoconfiguration or the javaagent, disable export by setting OTEL_TRACES_EXPORTER=none. Full error message: unknown service opentelemetry.proto.collector.trace.v1.TraceService
往往是 collector 的配置文件中没有配置 service.pipelines.traces,可以选择直接关闭 trace 的功能即可,启动命令如下:java -javaagent:./opentelemetry-javaagent.jar "-Dotel.traces.exporter=none" -jar .\bootJar.jar
更多 agent 的配置参数可以参考官方文档:https://opentelemetry.io/docs/instrumentation/java/automatic/agent-config/
tip
java agent 支持直接导出成 prometheus 格式的数据,供监控端拉取,当然可以用 collector 主动拉取的方式获取数据后进行加工处理,也可以不部署 collector,在prometheus 上直接对应用的 metric 进行拉取
参考文章:
- https://grafana.com/blog/2022/06/23/how-to-send-logs-to-grafana-loki-with-the-opentelemetry-collector-using-fluent-forward-and-filelog-receivers/
- https://grafana.com/blog/2022/05/04/how-to-capture-spring-boot-metrics-with-the-opentelemetry-java-instrumentation-agent/
- https://github.com/open-telemetry/opentelemetry-java/blob/main/sdk-extensions/autoconfigure/README.md
- https://github.com/open-telemetry/opentelemetry-collector-releases/releases
- https://github.com/open-telemetry/opentelemetry-java-instrumentation
- https://opentelemetry.io/docs/instrumentation/java/automatic/agent-config/